TL;DR
At Grid-OS we shipped GPS tracking hardware, but had no visibility into our own fleet : we leaned on the third-party dashboards to see where units were, analyse there telemetry data and more. That meant no control over the data,development delays and zero ability to build features on top.
I built an in-house device management platform from the ground up: a multi-threaded TCP server that holds a live socket per device, a parsing layer that decodes the GT06 and AIS140 binary protocols, MongoDB for storage, and a React/Electron dashboard for the ops team. It handles both directions: ingesting live telemetry and dispatching commands back to devices , this resulted in cutting our operational overhead by 75%+ while powering orders for 500+ devices.
The problem
GPS trackers open a long-lived TCP connection to a server and stream compact binary packets (location fixes, heartbeats, alarms) whenever they have something to say. To command a device : reboot it, change its reporting interval, cut engine power, you have to write bytes back down that same open socket.
Before this project, all of that lived inside vendor software:
- No data ownership. Telemetry sat in someone else's database; we couldn't query it, join it, or build on it.
- Development Delays. During development, live data comes in handy for debugging, given the client dashboard - a lot of times we were not able to access the data quickly.
- No product surface. We couldn't ship customer-facing features (geofences, trip history, device health) because we didn't control the pipe.
The goal: own the entire path from the antenna to the operator's screen.
Constraints that shaped the design
- Devices are stateful and long-lived. Each tracker keeps a single TCP socket open for hours. Whatever server design I chose had to hold thousands of these connections simultaneously and know which socket belongs to which device.
- Commands originate from a stateless world. The dashboard talks HTTP. An HTTP request that says "reboot device 42" has no idea which TCP thread is holding device 42's socket — and the two live in completely different execution contexts.
- Multiple binary protocols. Our fleet mixed GT06 and AIS140 devices. Same job, different wire formats.
- Small team, real deadlines. It had to be operable and debuggable by a couple of engineers, not a platform team.
Architecture
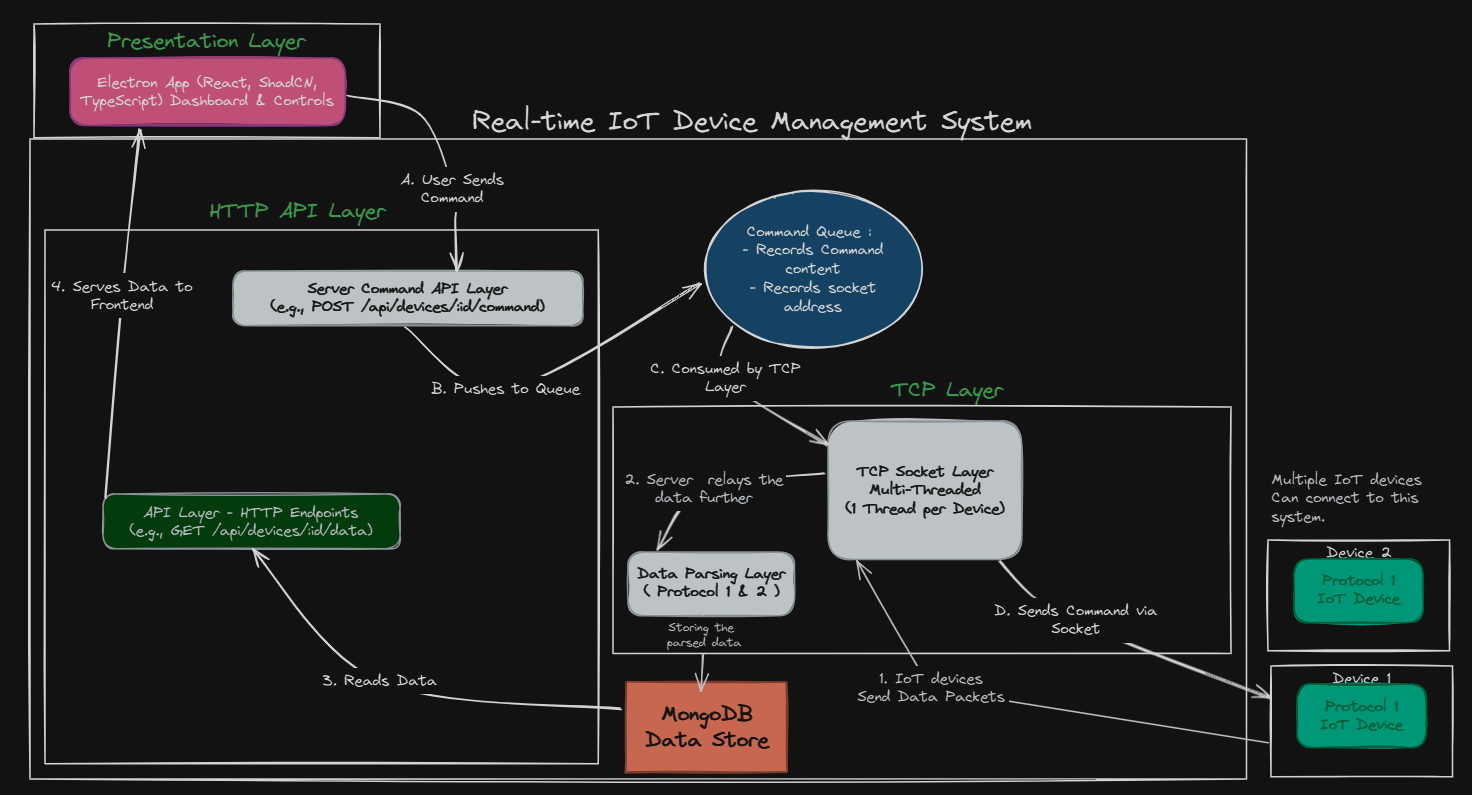
The system splits into four layers, with MongoDB as the shared source of truth. There are two flows running through it at once — telemetry coming up from devices, and commands going down to them.
Telemetry flow (device → operator)
- Devices send data packets. Each IoT device opens a TCP connection and streams binary packets into the TCP Socket Layer.
- The TCP server relays the raw bytes to the Data Parsing Layer, which decodes them per protocol (GT06 / AIS140) into structured records and writes the parsed data to MongoDB.
- The HTTP API reads the stored telemetry from MongoDB.
- The API serves it to the frontend : the React.js dashboard renders live device state and history.
Command flow (operator → device)
- An operator sends a command from the dashboard.
- The API pushes the command onto a queue instead of trying to talk to the device directly.
- The TCP layer consumes the queued command.
- It writes the command bytes down the correct device's socket.
The key decision: a command queue keyed by socket
The hardest part wasn't parsing bytes, it was the impedance mismatch between the two flows. Telemetry is stateful and lives on a persistent socket inside a TCP thread. Commands are born in a stateless HTTP handler that has no reference to that socket.
The naive approach : have the HTTP handler reach into the TCP server and grab the socket, this couples the two layers tightly and falls apart the moment they run as separate processes or across a restart.
Instead, I decoupled them with a command queue that records two things:
- the command content (what to send), and
- the socket address (which connection to send it on).
{
  "deviceId": "GT06-000042",
  "command": "DYD#", // e.g. cut-off / restore engine power
  "socketAddress": "10.0.3.14:53122",
  "enqueuedAt": "2025-09-20T10:22:31Z"
}
Now the HTTP API stays completely stateless: it validates the request, enqueues the job, and returns immediately. The TCP layer : the only part that actually owns the sockets , consumes from the queue and dispatches to the matching connection. When a device connects, its thread registers its socket address; the queue uses that to route.
This one boundary bought a lot:
- Clean separation of concerns — HTTP never touches raw sockets.
- Resilience — a command that arrives while a device is momentarily disconnected can be held rather than dropped.
- Debuggability — every command is an inspectable record with a timestamp, not a fire-and-forget socket write.
The multi-threaded TCP server
Each connected device gets its own thread holding its socket (1 thread per device in the diagram). A thread is responsible for the full lifecycle of one connection: read incoming packets, hand raw bytes to the parsing layer, and write out any commands the queue routes to it.
This model was a deliberate trade-off. An async/event-loop server would scale to more connections per box, but the thread-per-device model was dramatically simpler to reason about and debug for our fleet size, each device's story is a single, linear thread you can log and trace end to end. For a small team shipping fast, this architecture bought in clarity and speed while shipping.
The parsing layer
GT06 and AIS140 encode the same concepts (position, speed, ignition, alarms) in different binary layouts. I isolated all of that into a Data Parsing Layer with a parser per protocol, so the TCP threads stay dumb about wire formats and the rest of the system only ever sees clean, normalized records. Adding a third protocol later meant writing one more parser, that's it.
The dashboard
The operator-facing surface is an Electron app built with React, ShadCN, and TypeScript, using the underlying backend APIs made using Flask (Python) It reads device data through the API layer and issues commands through the command endpoint ,it never knows TCP exists.
Outcome
- 75%+ reduction in operational overhead — the team monitors and controls the entire fleet from one in-house tool instead of juggling vendor dashboards.
- Full data ownership — every telemetry record lands in our MongoDB, queryable and ready to build features on.
- A real product surface — geofencing, trip history, and device-health features became possible because we finally controlled the pipe.
What I'd revisit
- Swap threads for an async event loop past a certain connection count : the thread-per-device model is beautifully simple but eventually costs memory.
- Back the queue with Redis / a broker : the queue concept was the right call but at the time I had it in-memory; making it durable and horizontally scalable is the natural next step.
- Add backpressure & dead-letter handling for commands to devices that stay offline, instead of relying on timeouts.
The biggest lesson: the interesting engineering wasn't in any single layer, it was in the seam between the stateful and stateless halves of the system. Getting that boundary right (the command queue) is what made everything else simple.